Australia posted 431/2 against South Africa on 24 August 2025 in Mackay — centuries from Travis Head (142 off 103), Mitchell Marsh, and Cameron Green. South Africa replied with just 155. A 276-run gap between two ODI innings from elite international teams, in a single match, in 2025. The both innings runs comparison market — which team scores more, and by how much — sits at the intersection of batting analysis, pitch reading, and squad depth. In ODI cricket, where 50 overs and collapses can turn a 300 into a 220, it is one of the richest analytical markets available.
Why Comparing Both Innings Scores Matters In ODI Betting
The both innings runs comparison market is built on a fundamental ODI truth: the two innings in a match are not equally weighted. The first innings sets the ceiling. The second innings is shaped entirely by the target — either inflated by aggressive chasing or suppressed by a low-scoring surface. This asymmetry is the analytical starting point for every comparison bet.
A high first innings score puts pressure on the opposing team, often forcing them into a more aggressive and risk-laden approach. Conversely, a low first innings score can shift momentum in favour of the chasing team, allowing them to play more conservatively. This dynamic directly affects the both innings comparison — not just who scores more, but by what margin.
The comparison market asks several questions simultaneously: Will the first innings total be higher than the second? By how many runs? Or will a successful chase produce a second innings score that surpasses the first? Each of these outcomes has identifiable analytical drivers.
Understanding Both Innings Runs Comparison Markets
The both innings runs comparison market operates in several forms depending on the bookmaker:
- Higher/Lower team total: Which team will score more runs across their innings? Team A (batting first) vs Team B (batting second). Odds reflect both team quality and pitch conditions.
- Run margin bracket: Will the difference between both innings be 0–20, 21–50, 51–100, or 100+? This is a precise bracket bet on how different the two totals will be.
- First innings vs second innings Over/Under combined: Both innings totals are added or compared directly, with a line set at a specific run total difference.
Settlement rules confirmed across major platforms:
– Both innings must be completed for the market to settle — rain interruptions that reduce overs on either innings typically void the comparison market
– DLS-adjusted scores are used when the second innings is affected by weather — this is a critical settlement nuance that can change the apparent comparison outcome
– Declared innings in limited-overs cricket are treated as the final score at the point of declaration
How Bookmakers Set Score Comparison Odds
Bookmakers construct comparison odds using venue averages, both teams’ recent batting averages in the same format and conditions, and pitch type. The structural challenge is that the second innings score is only partly predictable — it is influenced by the first innings total, which itself is unknown pre-match.
As batting powerplays and other fielding restrictions have come into play, 400+ totals have become more common. This trend forces bookmakers to continuously recalibrate their expected score distributions upward. A first innings average of 280 in 2015 is now closer to 310 for top-eight ODI teams in 2025 — bookmakers that use older baseline data will underprice the high-scoring brackets.
The key opportunity: when same-day pitch, weather, and team selection information reveals that conditions strongly favour or disfavour batting, the comparison odds set before toss may carry structural mispricing.
Key Factors That Influence Team Run Totals
Batting order depth: Top order runs, scored by the top three or four batsmen, are essential as they anchor the innings and set the pace in the first innings, or stabilize the chase in the second innings. Middle order runs are vital for maintaining the innings’ flow and recovering from early losses, often steering the team through the middle overs in both innings. Lower order runs, scored by the tail-end batsmen, can be decisive in adding valuable runs towards the end of the first innings, turning a competitive score into a winning total, or in clinching close chases in the second innings.
Partnership quality in chasing: The most significant discovery of this analysis is the consistent higher effect sizes in the second innings compared to the first innings across all partnership performance indicators. This highlights the critical importance of these partnerships in successfully chasing a target. Strong second innings partnership depth therefore compresses the gap between both totals — teams with quality through the order at positions 4-7 consistently produce second innings totals closer to the first innings score.
Wicket preservation in the first innings: The negative effect sizes associated with the number of wickets lost in the first innings underscore the detrimental impact of early wickets on match outcomes. The heightened significance of early wicket preservation post-2000 indicates a tactical shift towards building solid partnerships and minimizing early collapses. Teams with aggressive openers who also carry first-innings risk (high dismissal probability) produce more variance in both innings comparison markets.
Smart Strategies For Both Innings Score Betting
Pitch Conditions And Match Situation Impact:
The pitch report is the single most important pre-match input for both innings comparison betting. Three pitch archetypes produce distinct score comparison patterns:
Flat batting surfaces (e.g., Wankhede Mumbai, Chinnaswamy Bengaluru, Eden Gardens Kolkata): Both innings converge toward high totals. The comparison gap shrinks because a flat pitch doesn’t deteriorate dramatically between innings. Teams batting second enjoy similar conditions to the first innings team. England’s record ODI total of 498/4 against the Netherlands in Amstelveen in 2022 was set on a flat surface — and the Netherlands’ reply of 244 created a 254-run gap not because of pitch degradation but because of quality disparity. On genuinely flat surfaces between comparable teams, the comparison gap is typically 20–50 runs.
Deteriorating spin-friendly pitches (e.g., Chepauk Chennai, Gaddafi Stadium Lahore): The first innings total is often compressed by early moisture or seam, then the pitch dries and turns for the second innings — or vice versa. The comparison gap can swing dramatically based on which innings benefits from which phase of pitch behaviour. Batting second on a turning track is structurally more difficult, widening the comparison gap in favour of the first innings total.
Seaming green-top pitches (e.g., Hagley Oval Christchurch, Lords London): Early dismissals inflate the first innings significance. The team batting first often sets a lower total (150–220) that the second innings team surpasses if they bat more carefully against an older ball. The comparison gap here is highly match-situation dependent — if the first innings collapses to 180 and the second innings targets 181, the gap is tiny regardless of bowling conditions.
| Pitch Type | Expected Innings Gap | First or Second Higher |
| Flat batting surface | 20–60 runs | Variable (second often closer) |
| Spin-deteriorating | 40–100 runs | First innings typically higher |
| Seaming early, flat later | 10–40 runs | Second innings often surpasses |
| Full deterioration (rare in ODIs) | 80–150+ runs | First innings dominant |
Batting Strength And Middle Order Depth
India’s ODI batting structure illustrates why middle order depth is the key comparison variable. With Virat Kohli, Rohit Sharma, and Shubman Gill as the top three, and Shreyas Iyer, KL Rahul, and Hardik Pandya at positions 4-6, India’s middle order depth means their second innings total consistently approaches or exceeds first innings scores from opposition teams. Virat Kohli broke Sachin Tendulkar’s record of most centuries scored in men’s ODI cricket at the 2023 Cricket World Cup — a player of this calibre in the middle of a chase changes the comparison probability dramatically.
The practical application: when a team with deep middle order strength bats second, the comparison gap compresses. Back the second innings total being closer to — or exceeding — the first innings score. When a team with tail-heavy batting (quality falls sharply after position 6) bats second, the comparison gap widens.
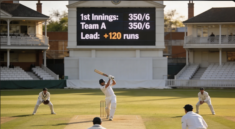
The Australia example (24 August 2025 vs South Africa): Travis Head’s 142 off 103 anchored a 431/2 first innings. South Africa’s response of 155 — a 276-run gap — reflected a combination of quality disparity AND pitch impact after a dominant first innings powerplay had compressed South Africa’s chase intent. The both innings margin over 100 bracket was the structural bet in this match type.
Both teams 400+ scenario: There have been two occurrences where both teams in a match have scored more than 400 in their respective innings — the first one being the Australia and South Africa match in 2006, and the other occurrence being India and Sri Lanka in 2009. These extreme convergences — where both innings totals are nearly equal — are the rarest outcome in comparison markets but confirm that the right conditions and squads can produce negligible gaps even at elite scoring levels.
Conclusion: Improving Accuracy In ODI Score Comparisons
Three inputs, sequenced in order of importance, produce consistent accuracy in both innings runs comparison betting:
- Identify the pitch archetype (flat, spinning, seaming) and map it to its typical innings comparison distribution. This is your baseline before any team-specific analysis.
- Assess middle order depth for the chasing team. Deep batting through position 7 compresses the comparison gap. Tail-heavy batting widens it. This is the most underrated variable in both innings comparison markets.
- Confirm the toss decision and apply it as a modifier. A team that wins the toss and bats first on a flat pitch is setting the comparison ceiling. A team that wins the toss and bats second on a turning track is signalling that the second innings will be harder — meaning the comparison gap widens in favour of the first innings total.
Combined, these three inputs give you a calibrated view of both the direction and magnitude of the innings comparison — the foundation of every accurate bet in this market.