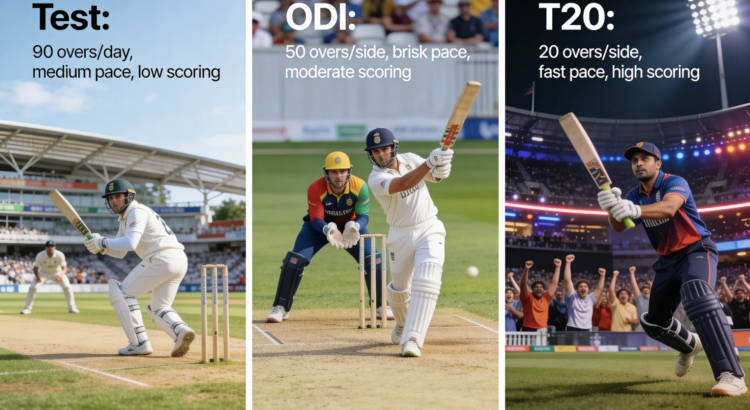
Three formats. Three completely different betting environments. The punter who approaches Test cricket with T20 instincts loses money. The one who applies Test patience to T20 in-play markets misses the window entirely. Understanding how each format changes the structure of betting — the markets available, the variance level, the toss significance, the live timing — is the foundation of consistent cricket betting across the full calendar year.
How Match Format Changes Betting Dynamics
The three formats differ across four dimensions that directly affect betting strategy:
| Dimension | Test | ODI | T20 |
| Duration | 5 days | 1 day (8 hrs) | 3–3.5 hours |
| Draw possible? | Yes (~30%) | No | No |
| Variance level | Low (most predictable) | Medium | High |
| Best market type | First innings lead, session runs | Match winner, top scorer | Live in-play, boundaries, totals |
| Live betting window | Hours per session | 2–3 key moments | Every 2–3 balls |
These dimensions determine which betting approach produces the most consistent value in each format.
Test Cricket Betting Characteristics
Test cricket is the most analytically stable format for betting. With five days of play and two innings each, results unfold slowly and rely heavily on tactical depth. This longer arc gives bettors time to study form, player matchups, and conditions with more clarity.
Three characteristics define the Test betting environment:
The draw market: Approximately 30% of all Tests end in draws — a genuine third outcome that makes match-winner betting structurally different from limited overs. The draw must be priced and considered. When a match enters day 5 with rain forecast and both teams holding equal sessions, the draw market compresses significantly and often represents the highest-probability outcome at that point.
Session betting: Morning, afternoon and evening sessions can be bet independently. Each session produces a natural unit of analysis — pitch freshness, new ball timing, fatigue across 90+ overs. The morning session on day 1 with a new ball on a damp pitch is the highest-wicket-producing phase in most Test venues. Structuring bets around sessions reduces the five-day uncertainty into manageable 90-minute units.
Patience and information accumulation: By the end of day 2, you know the first innings total, the pitch behavior across two days, and the match position. Bets placed on day 3 morning with this information advantage are structurally superior to any pre-match wager. The best Test bets are often placed on day 2 or day 3 — not before the first ball.
ODI Betting Approach And Market Behavior
ODIs offer a more balanced tempo that rewards both preparation and flexibility. With 50 overs per side, this format provides enough time for a team to recover from early stumbles while enforcing time pressure. From a betting standpoint, ODIs allow deeper analysis. Factors like batting depth, bowler rotation strategy, and mid-innings run rates become meaningful metrics.
ODI betting has four structural characteristics:
The middle overs (15–40) as the key phase: Unlike T20 where the powerplay and death overs dominate, ODI innings are defined by what happens in the middle 26 overs. A team building at 5 runs per over in overs 20–35 sets up a competitive total; a team losing wickets at that stage collapses. Live match-winner markets move most dramatically during mid-innings wicket clusters.
Bowling rotation predictability: ODI captains use their five bowlers in a more predictable rotation than T20 captains. Top wicket-taker markets benefit from this structure — if Bumrah is bowling the first 10 overs in an ODI, you know approximately how many deliveries he will face per innings (typically 60). This predictability makes top bowler markets more analysable in ODIs than in T20s.
Historical head-to-head data reliability: In ODIs, Australia has historically had a strong record against South Africa. This historical data can help gauge potential outcomes. In the longer ODI format, team-level historical patterns are more predictive than in T20 where individual brilliance frequently overrides structural patterns.
Average scores as anchors: The average score for top 8 teams in ODIs has been approximately 273 (2015–2022 data), with the number rising annually. This benchmark anchors total runs Over/Under line assessment. A line set significantly above 280 at a flat pitch against weaker bowling requires clear structural justification.
T20 Betting Trends And High-Volatility Factors
T20 is the highest-variance betting format. High Frequency of Upsets: Due to the format’s rapid nature, upsets are more frequent compared to Test and ODI matches. Individual Performances: In T20s, one standout performance — be it a quick-fire knock or a match-winning spell of bowling — can decide the outcome.
Three structural T20 betting realities:
One player can redefine a match: A single over by Hardik Pandya in the death or a 30-ball 70 by Travis Head changes the entire market trajectory. This individual volatility means pre-match T20 bets carry higher variance than ODI or Test equivalents — position sizing should reflect this.
Powerplay is the primary live signal: IPL 2025 data shows the average powerplay score in the first five matches was dramatically above historical baselines, with eight scores of 60+ in the first 10 innings. A team’s powerplay position (score vs wickets) at over 6 is the single strongest indicator of the innings total and the most reliable live betting trigger.
In-play is more profitable than pre-match: Momentum shifts are frequent in T20 cricket, making in-play betting much more profitable than pre-match betting. The 15–30 second window after a wicket or a six-heavy over is where T20 betting value concentrates — the algorithm adjusts, but rarely instantaneously.
Comparing Run Totals Across Formats
| Format | Average first innings score (top teams) | Range | Typical O/U line |
| T20 International | 155–175 | 100–250+ | 155–180 |
| IPL (2024–25) | 180–195 | 120–287 | 175–200 |
| ODI | 273 (historical avg, rising) | 200–380 | 270–290 |
| Test (1st innings) | 330–350 (current era) | 150–700+ | 300–350 |
The volatility range tells the betting story: T20 totals can swing 150 runs between a collapsed innings and an explosive one. Test first innings can range from 150 (collapse) to 700+ (historic total). This range difference directly determines appropriate unit sizing — smaller units in T20 totals, larger units in Test session runs where variance is structurally lower.
Player Performance Markets By Format
Test cricket: Top batsman markets favour No. 3 and No. 4 positions — they combine security with time to build. Joe Root (12,972 Test runs), Steve Smith (Avg 56.92) and Yashasvi Jaiswal in current form are structurally strong top-batsman selections in Tests. Top bowler markets favour new-ball openers on day 1 and spinners from day 3 onwards on subcontinent pitches.
ODI cricket: Openers face the most balls and top run-scorer markets structurally favour them. Death-over bowlers (Bumrah’s ODI economy of 5.00 in 2023) are the top wicket-taker selection in the final 10 overs. Player of the match in ODIs most commonly goes to the top scorer (48% of awards historically) rather than the top wicket-taker.
T20 cricket: Confirmed openers dominate top batsman markets — they face 25–35 balls on average vs 8–15 for a No. 6. Death-over specialists (Bumrah, Arshdeep, Pathirana) dominate wicket markets due to increased attacking play in overs 16–20. All-rounders (Stokes, Hardik Pandya) hold the highest player-of-the-match probability because they can contribute in both markets simultaneously.
Toss Importance In Different Match Types
Toss significance varies dramatically by format:
T20: In T20 internationals, toss-winning teams secure victories in about 52–55% of games. The dew factor in evening T20s is the primary driver — at venues like Mumbai’s Wankhede Stadium, where dew affects evening games, teams winning the toss and choosing to chase have a 57% win rate. At the T20 World Cup held in the UAE, research found that around two-thirds of matches saw the toss-winning team go on to win the game — the highest toss impact of any major competition.
ODI: Data from 1,500+ ODI matches show that the team winning the toss wins the match approximately 47–50% of the time. Lower than T20, because the longer format allows more recovery from suboptimal starting conditions.
Test: Toss significance varies more by venue than format. In England (swing conditions), batting first after winning the toss carries lower historical win rates than intuition suggests — at Edgbaston, teams batting first win only 13 of 40 Tests. In Australia, where pitches are truer, batting first remains beneficial through day 2 before deterioration sets in.
Live Betting Opportunities And Timing Strategy
| Format | Best live window | Key trigger |
| Test | Day 3 morning | Overnight position: lead, wickets, pitch state |
| ODI | Over 35–40 of first innings | Total projected vs line; death bowler confirmation |
| T20 | Overs 7–10 after powerplay | Powerplay score and wickets in hand |
Test live betting rewards patience — the best Test live bets come after 2 days of information accumulation. ODI live value concentrates in the acceleration phase when the batting team’s total starts to crystallise. T20 live value comes fastest and disappears fastest — the 10–15 second window post-wicket is the core execution zone.
Risk Management For Multi-Format Betting
The critical error in multi-format betting is applying uniform unit sizes across all formats. T20 requires smaller units than Test due to higher variance:
| Format | Recommended unit | Reasoning |
| Test — session markets | 2% of bankroll | Lower variance, longer settlement, more information |
| ODI — match winner | 1.5% of bankroll | Medium variance, full-day commitment |
| T20 — match winner | 1.5% of bankroll | Higher variance than ODI at match level |
| T20 — live props | 0.75–1% of bankroll | Highest variance; position sizing critical |
Choosing The Right Format For Your Betting Style
If you’re seeking consistency and a lower variance environment, ODIs tend to be the most bettor-friendly. They provide a structured flow and enough data reliability to make smart pre-game predictions. For those who thrive on quick decision-making and embrace volatility, T20s offer high-reward live betting windows — provided you can keep up. Meanwhile, Test cricket demands time, but it offers more stable odds over a longer betting window.
The honest self-assessment:
– Data-first, patient, analytical bettor → Test cricket and ODIs. The information advantage compounds over time. Avoid T20 live betting until analytical process is fully established.
– Real-time decision maker, comfortable with volatility → T20 in-play. Start with match-winner markets before advancing to over-by-over props.
– Building experience → Start with ODI match-winner markets. The format’s pace allows enough time to think, research and decide without the T20 time pressure.
The format you choose should match your analytical bandwidth, time availability, and psychological relationship with variance — not simply which format seems most exciting to watch.